
What 72,000 Concrete Mixes Reveal About Cement Replacement
Intro
This is the first of a two-part post analyzing Supplementary Cementitious Materials (SCMs) in concrete mixes from the Building Transparency EC3 database. EC3 is a publicly accessible platform and database of Environmental Product Declarations (EPDs) focused on building materials (I previously did a deep dive on some of the EC3 data). This first post focuses on how SCMs show up across the dataset. The second will look at a geographic mapping I developed around access to fly ash in the continental US.
Supplementary Cementitious Materials (SCMs) are materials used in concrete as a partial replacement for portland cement, and are commonly industrial byproducts. Cement production accounts for roughly 8% of global CO₂ emissions, making cement reduction one of the most impactful levers for lowering concrete’s embodied carbon.

In practice, SCMs serve three primary purposes:
- Reduce embodied carbon
- Improve durability and performance
- Optimize workability and long-term strength development
This analysis focuses on the first: reducing embodied carbon.
Industry benchmarks around the impact of SCMs on GWP are often set using methodologies established by industry organizations such as the American Concrete Institute (ACI). However, concrete mix design is nuanced, and those benchmarks don’t always reflect how mixes are actually produced. Using real-world data from EC3 I wanted to explore how often SCMs show up in mixes, which types are most common, and what we can actually learn from the data.
Understanding the Common SCMs: Fly Ash and Slag
Fly ash and slag (Ground Granulated Blast Furnace Slag, or GGBS) are currently the two most widely used SCMs in the US. Other SCMs include natural pozzolan, silica fume, ground glass, metakaolin, and limestone.
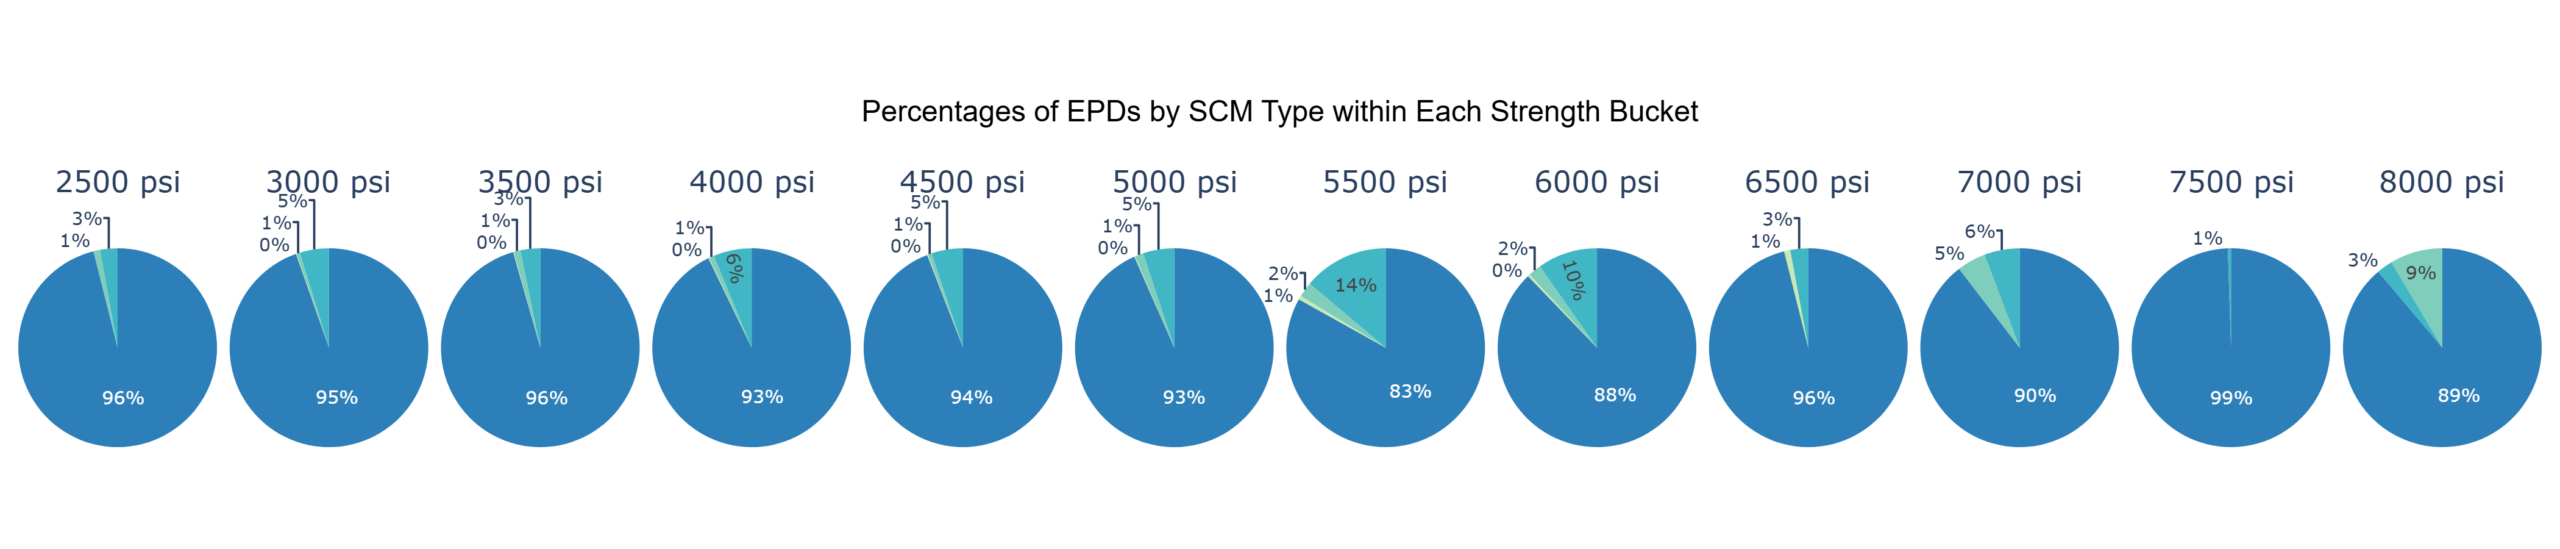
Of over 72,000 product EPDs pulled from the EC3 database (as of March 2026), the only SCMs recorded were fly ash (5.4% of mixes), slag (1.2% of mixes), and a combo of the two (0.1% of mixes). These numbers immediately felt off – the real percentages are likely much higher (I’ll come back to this). It was also surprising to see zero EPDs containing other SCM types. The EC3 schema includes fields for them, so this likely points to data entry limitations.
Regardless of the potential data entry issues, it’s a fairly safe assumption that currently fly ash and slag make up the majority of SCMs used in the US. This may change in the future as alternatives get further developed and the supply of both fly ash and slag continue to dwindle given that both of these materials are byproducts of industrial processes on the decline. Before diving into the analysis itself, let’s take a quick look at the state of production of both fly ash and slag within the US.
A useful source on fly ash – or more broadly “coal ash” – production in the US is the American Coal Ash Association (ACAA). As noted in their latest news release “Seventy-two percent of the coal ash produced during 2024 was recycled – increasing from 69 percent in 2023 and marking the 10th consecutive year that more than half of the coal ash produced in the United States was beneficially used rather than disposed.” In 2024 nearly 14.6 million tons of the fly ash recycled (not including “harvested” ash) went into ‘Concrete/Concrete Products/Grout’ and another nearly 3.4 millions tons went into ‘Blended Cement/ Feed for Clinker’, making these two applications by far the most common use of fly ash.
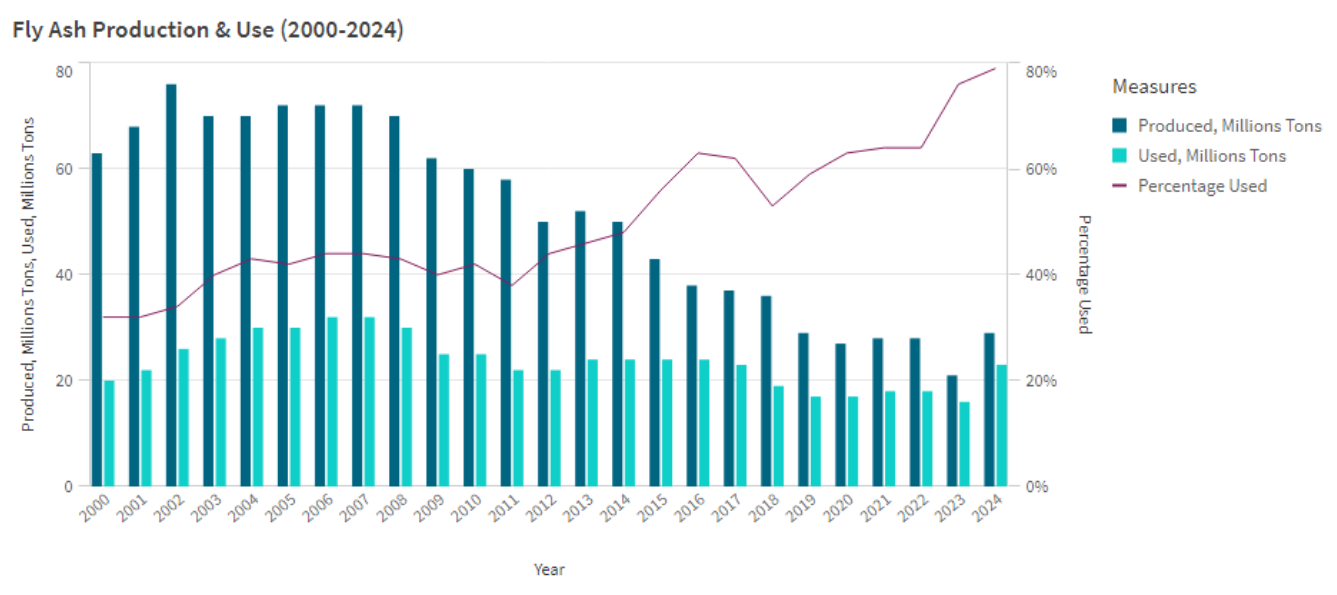
As seen in the above chart, while the production of fly ash as a whole has been on the decline due to coal being a declining energy source, the percent of fly ash recycled has been steadily increasing to the point where the total amount of fly ash recycled actually increased between 2023 and 2024. A couple of factors point to the continued production/extraction of fly ash for years to come. First, as noted in the report, soaring electricity demand forecasts have been delaying many of the anticipated plant closures, which means there will be a continuation of new fly ash being produced. Second, a “rapidly growing practice of harvesting previously disposed ash has begun to supply significant volumes of material to beneficial use markets.”
Ground Granulated Blast Furnace Slag production in the US, on the other hand, seems to have a more short-lived future. The production of GGBS, which is the specific type of slag most commonly processed and used as an SCM, is a byproduct of steel production in blast furnaces. However, the vast majority of the steel produced in the US now uses a more efficient means of production in electric arc furnaces (EAF). Global Slag News (yep, that’s a thing!) reported in 2023 that the United States Geological Survey (USGS) stated that “domestic GGBFS remained in limited supply in 2022 because granulation cooling was available at only two active US-based blast furnaces and only one local plant produced pelletised slag in limited supply.”
Given the limited production of slag within the US, it’s fair to assume that a significant portion of the slag used in concrete mixes in the US is getting imported. An accurate estimate on the import amount appears to be difficult to pin down, but that’s beyond the scope of this study. Material advances also appear underway in order to upcycle EAF slag into a GGBS-grade SCM, so the use of slag seems more likely to evolve than to go away.
Exploring the Data
My initial curiosity in SCMs began wanting to understand some of the geographic distributions of material sources (I focus on this more in my next post). As I started digging in, it became clear I first needed to understand what data actually exists in EC3 before jumping into geography. As previously mentioned, the only two SCMs used in product EPDs uploaded to EC3 as of this writing were Fly Ash and GGBS (slag), which is why the following analysis focuses on those.
As far as establishing some baseline data, the National Ready Mixed Concrete Association (NRMCA) is typically the source of truth in the ready mixed concrete industry. So it’s of use to compare some of what we see in the EPD database to how NRMCA approaches things. To begin with, according to the industry EPD published by NRMCA, there are approximately “8,000 plants across the ready mix industry in the United States.” Of the EPDs I pulled from EC3, these represented 1,211 plants across the US – ~15% of NRMCA’s estimate. This is not all that surprising seeing as many smaller batch concrete plants may not have EPDs – let alone have EPDs uploaded into the EC3 database. This industry EPD also focuses on fly ash and slag as the two primary SCM options.
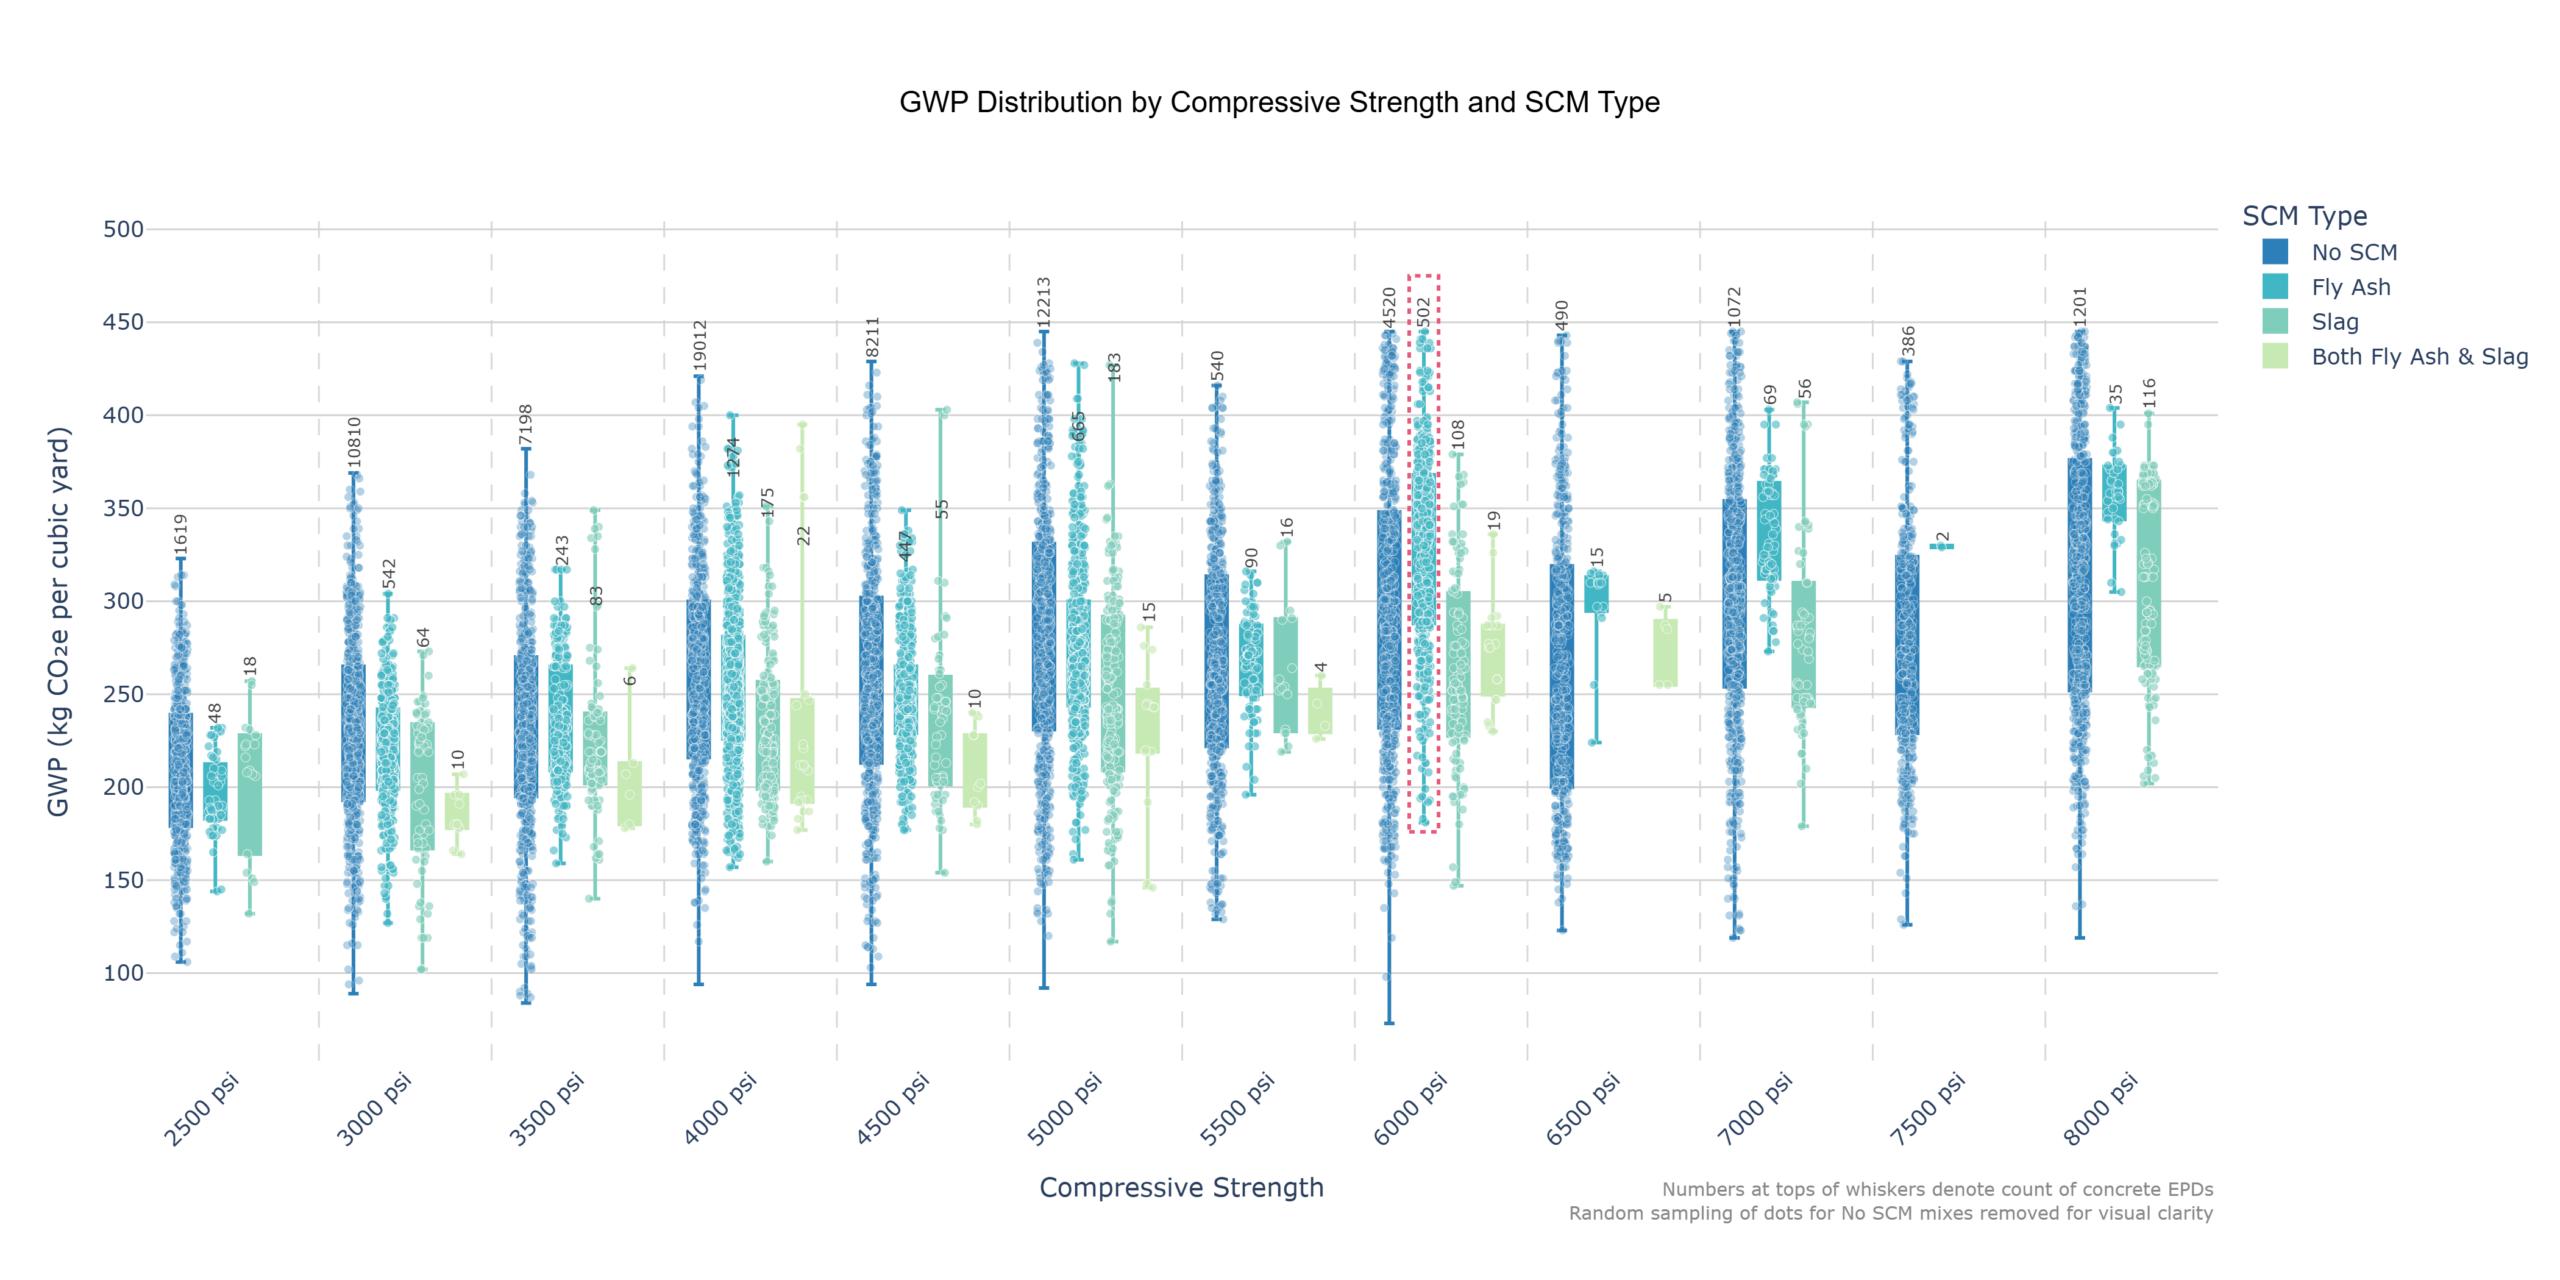
The chart below looks at the Global Warming Potential (GWP) distribution broken down by buckets for concrete strength and further grouped by SCM Type. Additionally, I’ve charted the percentage composition of the mixes at each strength. These charts combined communicate the count and percentage of mixes containing the different SCM types in the EC3 database.
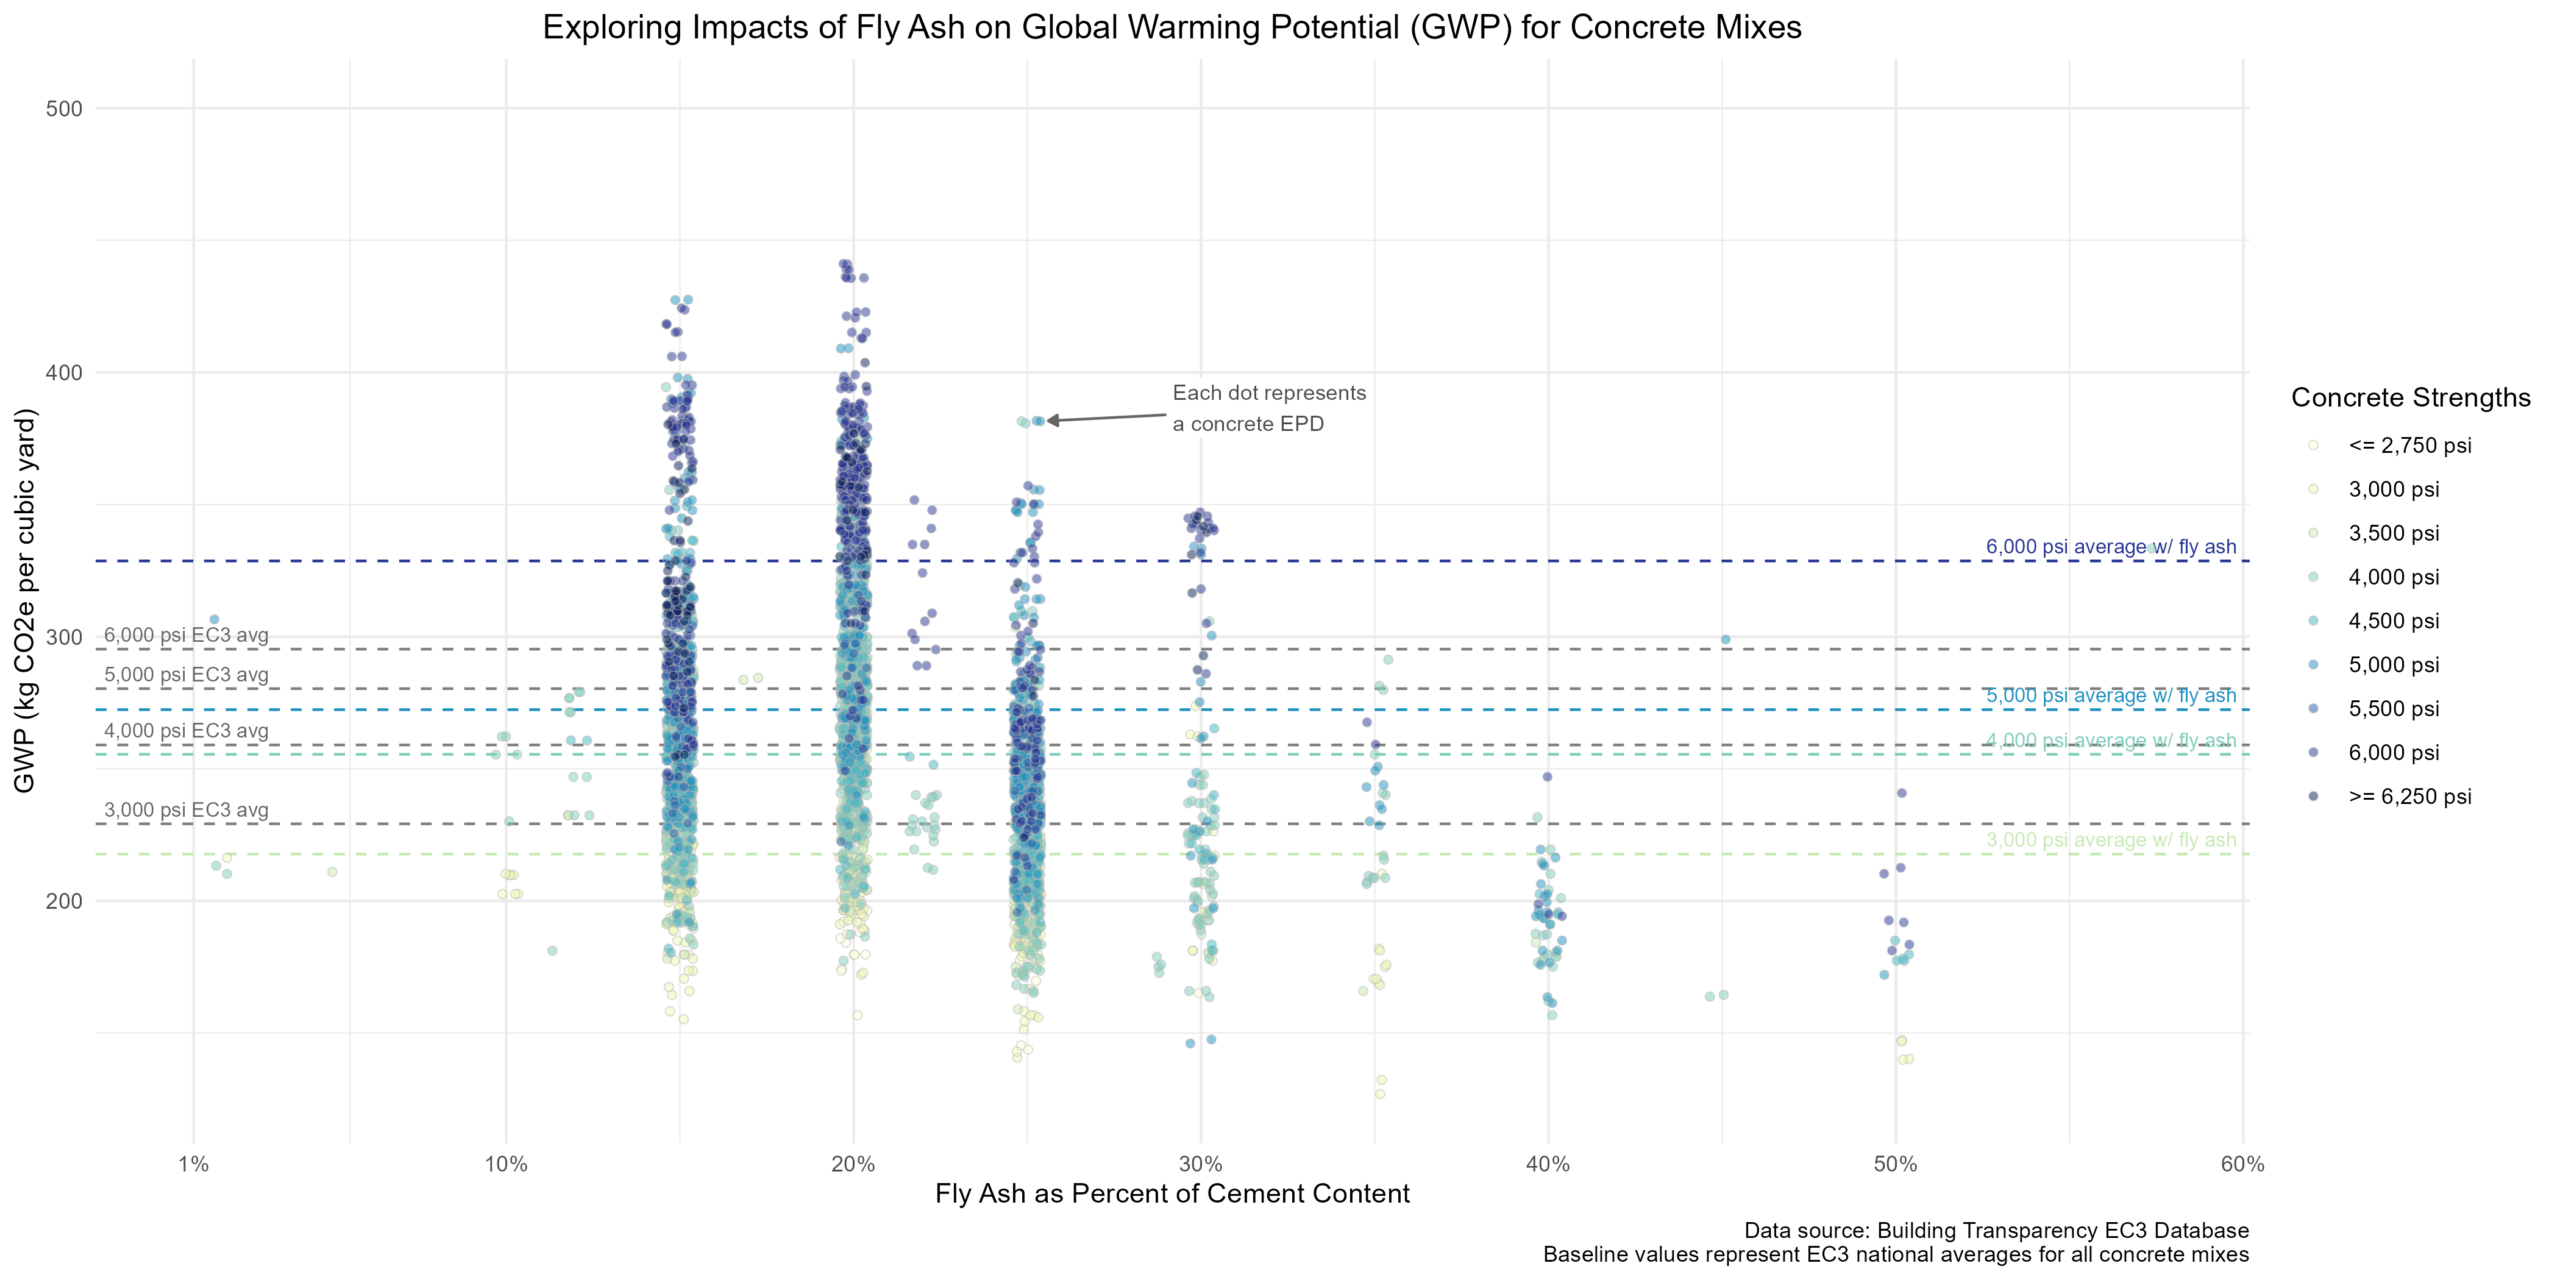
One of the other pieces of information we can extract from the EPD data is the percentage of cement being replaced by the SCM. When SCMs are used they are typically replacing just a fraction of the portland cement being used in a given mix rather than a one-for-one replacement. Focusing further on fly ash, I was interested to explore the interplay between GWP, cement replacement percentage, and compressive strength. While the data is mostly clustered around mixes containing 15%, 20%, and 25% replacement percentages, we can generally see the expected trend of higher fly ash percentages contributing to further reductions in GWP.
Findings
Two of the key findings from this analysis of the data are:
- The data in EC3 is likely incomplete in accounting for mixes that include SCMs
- The average GWP for mixes incorporating fly ash being higher than the total average GWP starting at around 6,000 psi suggests other factors are at play in these higher strength mixes.
Finding 1: Incomplete SCM Data
As noted previously, only 5.5% of all 72,000+ mixes analyzed reported using some percentage of fly ash. I suspect that a significantly higher percentage of mixes actually incorporate fly ash, but that the data is not getting captured in EC3.
So why do I think the real number is higher? Part of it is intuition from practice, but we can also sanity check it with some back-of-the-napkin math:
- Let’s start with the previously mentioned ACAA report that estimates nearly 14.6 million tons of the fly ash in 2024 going towards concrete and another nearly 3.4 million tons going towards blended cement / feed for clinker previously mentioned. This is a combined ~18 million tons, which is going towards concrete and cement products. We don’t know exactly how much of this is going towards ready-mixed concrete typically used in building construction, but since the ACAA breaks out applications like road base as their own category, I think it’s safe to say that the majority of this concrete is going towards ready-mixed concrete. Let’s conservatively put the range at 50%-75%. That equates to ~9 – 13.5 million tons of fly ash annually
- We know from the data that the most common % replacement in an individual mix is 20%.
cement displaced = 0.20/fly ash = 5×fly ash
- Based on our range, this is ~45M-67.5M tons of cement associated with fly ash mixes
- NRMCA estimates 400 million cubic yards of Ready-Mixed concrete was delivered in 2023 in the US.
- Cement content per cubic yard: ~0.275 tons per cubic yard
- Total Annual Ready-Mixed Cement Weight: 400M * ~0.275 = ~110M tons of cement annually
- Now we compare cement amount associated with fly ash mixes to total cement used:
- 45/110 = ~41%
- 67.5/110 = ~61%
- Estimated range of mixes incorporating fly ash: 41%-61%
There are definitely nuances I’m glossing over here, but even at the low end, this suggests an order-of-magnitude gap compared to the 5.5% observed in EC3.
While the cause of this discrepancy can be a mix of factors, I suspect the most common source is that EPDs don’t typically contain the quantity breakdown of SCMs. On projects this data is typically provided in a separate concrete submittal document, but this is not what gets uploaded to a database such as EC3. A useful analogy: the EPD contains the nutritional facts, while the concrete submittal contains the list of ingredients. The EC3 database is attempting to capture both sets of information, but only requiring the nutritional facts. Additionally, after uploading a PDF of an EPD to EC3 to be consumed into the database, there does not appear to be any obvious way for a user to go in and enter additional information.
This is not to say that the EC3 data is bad. It’s just incomplete when trying to analyze the impacts of SCMs. Even with just a small fraction of the uploaded EPDs having SCM data added, it still gives us thousands of data points to explore given the overall size of the dataset.
Finding 2: Increased GWP for Fly Ash Mixes at Higher Strengths
The charts generated from the EC3 data show an increase in the GWP value for mixes incorporating fly ash beginning at some of the higher strength mixes (around 6,000 psi and up). Of all the mixes in the 6,000 psi bucket in EC3 we see an average GWP of 295.3 kgCO2e/yd³ compared to an average GWP of 328.7 kgCO2e/yd³ for the mixes with fly ash. This is counter what we would expect to see based on the industry EPDs generated by NRMCA, which show GWP reductions as Fly Ash is added.

While I can only hypothesize as to the reasoning for this – here are a few thoughts:
- At higher strengths, fly ash is often getting added as an addition instead of a substitution. A couple reasons for this could be cost (fly ash is often cheaper than portland cement) and workability / pumpability. Higher strength mixes can often be stiffer and more difficult to pump, and the addition of fly ash particles which are spherical can actually help to improve flow.
- High-strength mixes already require elevated cement content to hit spec. When fly ash is introduced, the slower pozzolanic reaction means producers may over-design the mix (adding more total cementitious material) to ensure 28-day strength is reliably met, especially for specs with low tolerance for failure.
- Related to my previous finding of incomplete data, we may not be seeing the full picture. The EC3 database stores separate properties for compressive strength at 28 days, compressive strength “other”, and then an additional field for the number of days “other” could represent. It’s possible that since higher strength mixes incorporating fly ash are more likely to have an “other” final strength at something beyond 28 days, that these mixes are more prone to data entry issues.
Wrap-Up & Notes
At its core, this study is about a simple question: what does the data actually tell us about SCM use? On most building projects involving concrete, leveraging SCMs offers a unique opportunity since it’s a reduction that can be achieved with minimal impact on other design decisions. This analysis highlights both the opportunities that fly ash and slag offer, and where gaps in the data may exist.
In the next post, I’ll zoom out to geography and look at how fly ash supply across the US is distributed relative to concrete plant locations.
The full data analysis can be found here on GitHub.
This work was conducted as part of my capstone project for the Environmental Data Science Certificate Program at the Yale School of the Environment.